Material Tuning
Material Tuning uses three firmware calibration tests to optimize any filament on the Vision Miner 22IDEX V4:
- Temperature - layer adhesion and part strength
- Pressure Advance - eliminates blobs and gaps at corners
- Flow Rate - solid layers without gaps or over-extrusion
Run tests in order - each builds on previous results. Test files are available for download below, and also ship pre-loaded on the printer under Files > Jobs > Test Prints. Before starting: home, auto-calibrate, clean build plate, stabilize bed and chamber temperature.
Before you begin - safety and risk
Read the Safety - Before You Begin article before working on your printer. It covers electrical hazards, hot surfaces, moving parts, and other risks that could cause injury or equipment damage.
Test requirements - nozzle size and filament condition
0.4 mm nozzle required: All three tests are designed for 0.4 mm nozzles. Other sizes do not damage the printer but produce unreliable results. See FAQ for translating results to other diameters.
Dry filament required: Filament must be thoroughly dried before testing. Moisture causes inconsistent extrusion and unreliable results.
Tools and Materials
- Filament to calibrate (properly dried, 1.75 mm diameter)
- Material data sheet (for manufacturer's recommended print temperature range)
- Digital calipers
- 0.4 mm nozzle installed
- USB microscope or jeweler's loupe, 20×40× magnification (optional - flow rate analysis)
- Bed adhesive
1. Temperature Calibration
Temperature controls layer adhesion - too low and layers won't bond (weak parts), too high and material degrades (stringing, poor surface). The Temperature Tower prints six sections at increasing temperatures for strength and surface quality comparison across a range.
Determine Temperature Range
Before testing, calculate minimum and maximum test temperatures from manufacturer's data sheet.
Maximum temperature:
- Take manufacturer's highest recommended print temperature.
- Round up to nearest 10 °C (e.g., 345 °C - 350 °C).
- Add 10 °C buffer.
- If using stainless steel nozzle, add another 10-20 °C (steel has lower thermal conductivity than brass).
Minimum temperature:
- Take manufacturer's lowest recommended print temperature.
- Optionally subtract 5-10 °C to explore lower boundary.
Example temperature ranges
Brass nozzle - material rated 315-345 °C: minimum ≈ 310 °C, maximum ≈ 360 °C.
Steel nozzle with same material: minimum ≈ 310 °C, maximum ≈ 380 °C.
Narrower ranges give finer resolution. If first test covers 50 °C or more, run second pass with 20 °C range centered on best-performing section.
Run the Test
- Download latest Temperature Tower test file: temp_tower_test.gcode. A copy ships under
Files > Jobs > Test Prints. - In Web Interface, go to
Files > Jobs, click Upload, add downloaded file. - Select file and click Print. When prompted, enter minimum temperature and maximum temperature. Printer calculates temperature steps automatically.
- Wait for print to finish - approximately 30-60 minutes. Printer starts at minimum temperature and increases with each section, producing six sections total.
Analyze the Tower
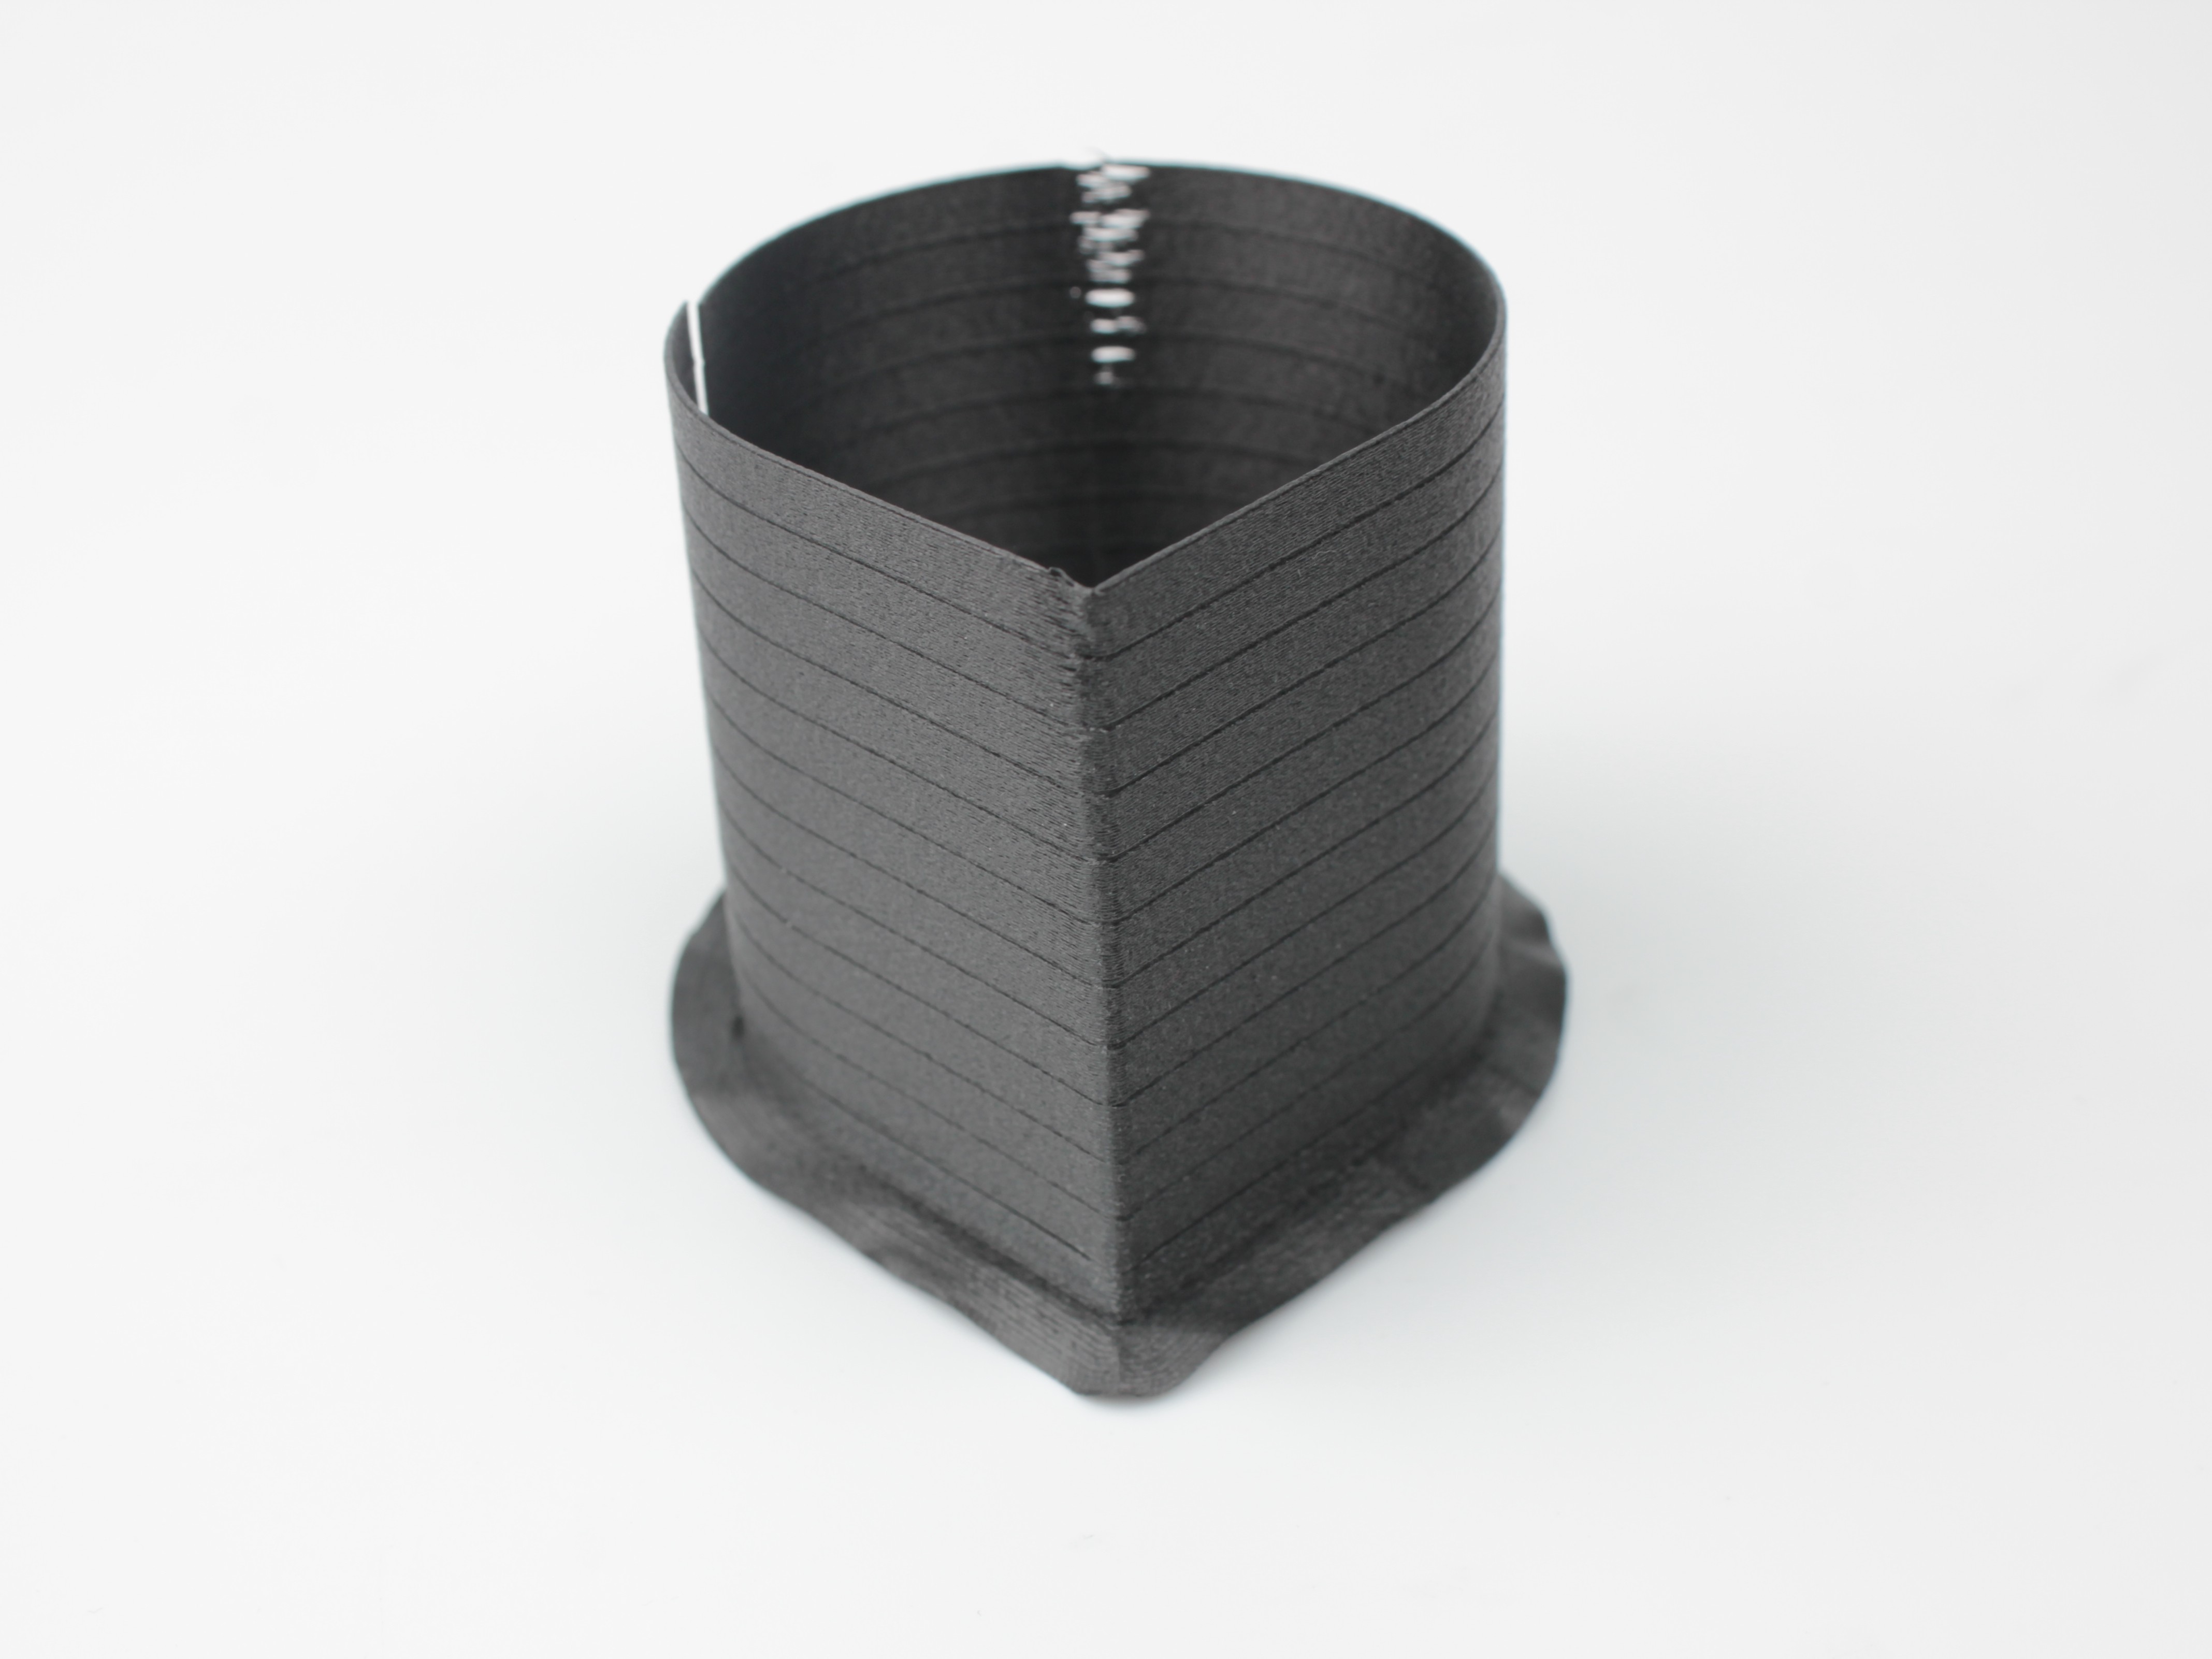
- Remove tower from build plate after full cooldown. Tower consists of six sections, with temperature increasing from bottom (coldest) to top (hottest).
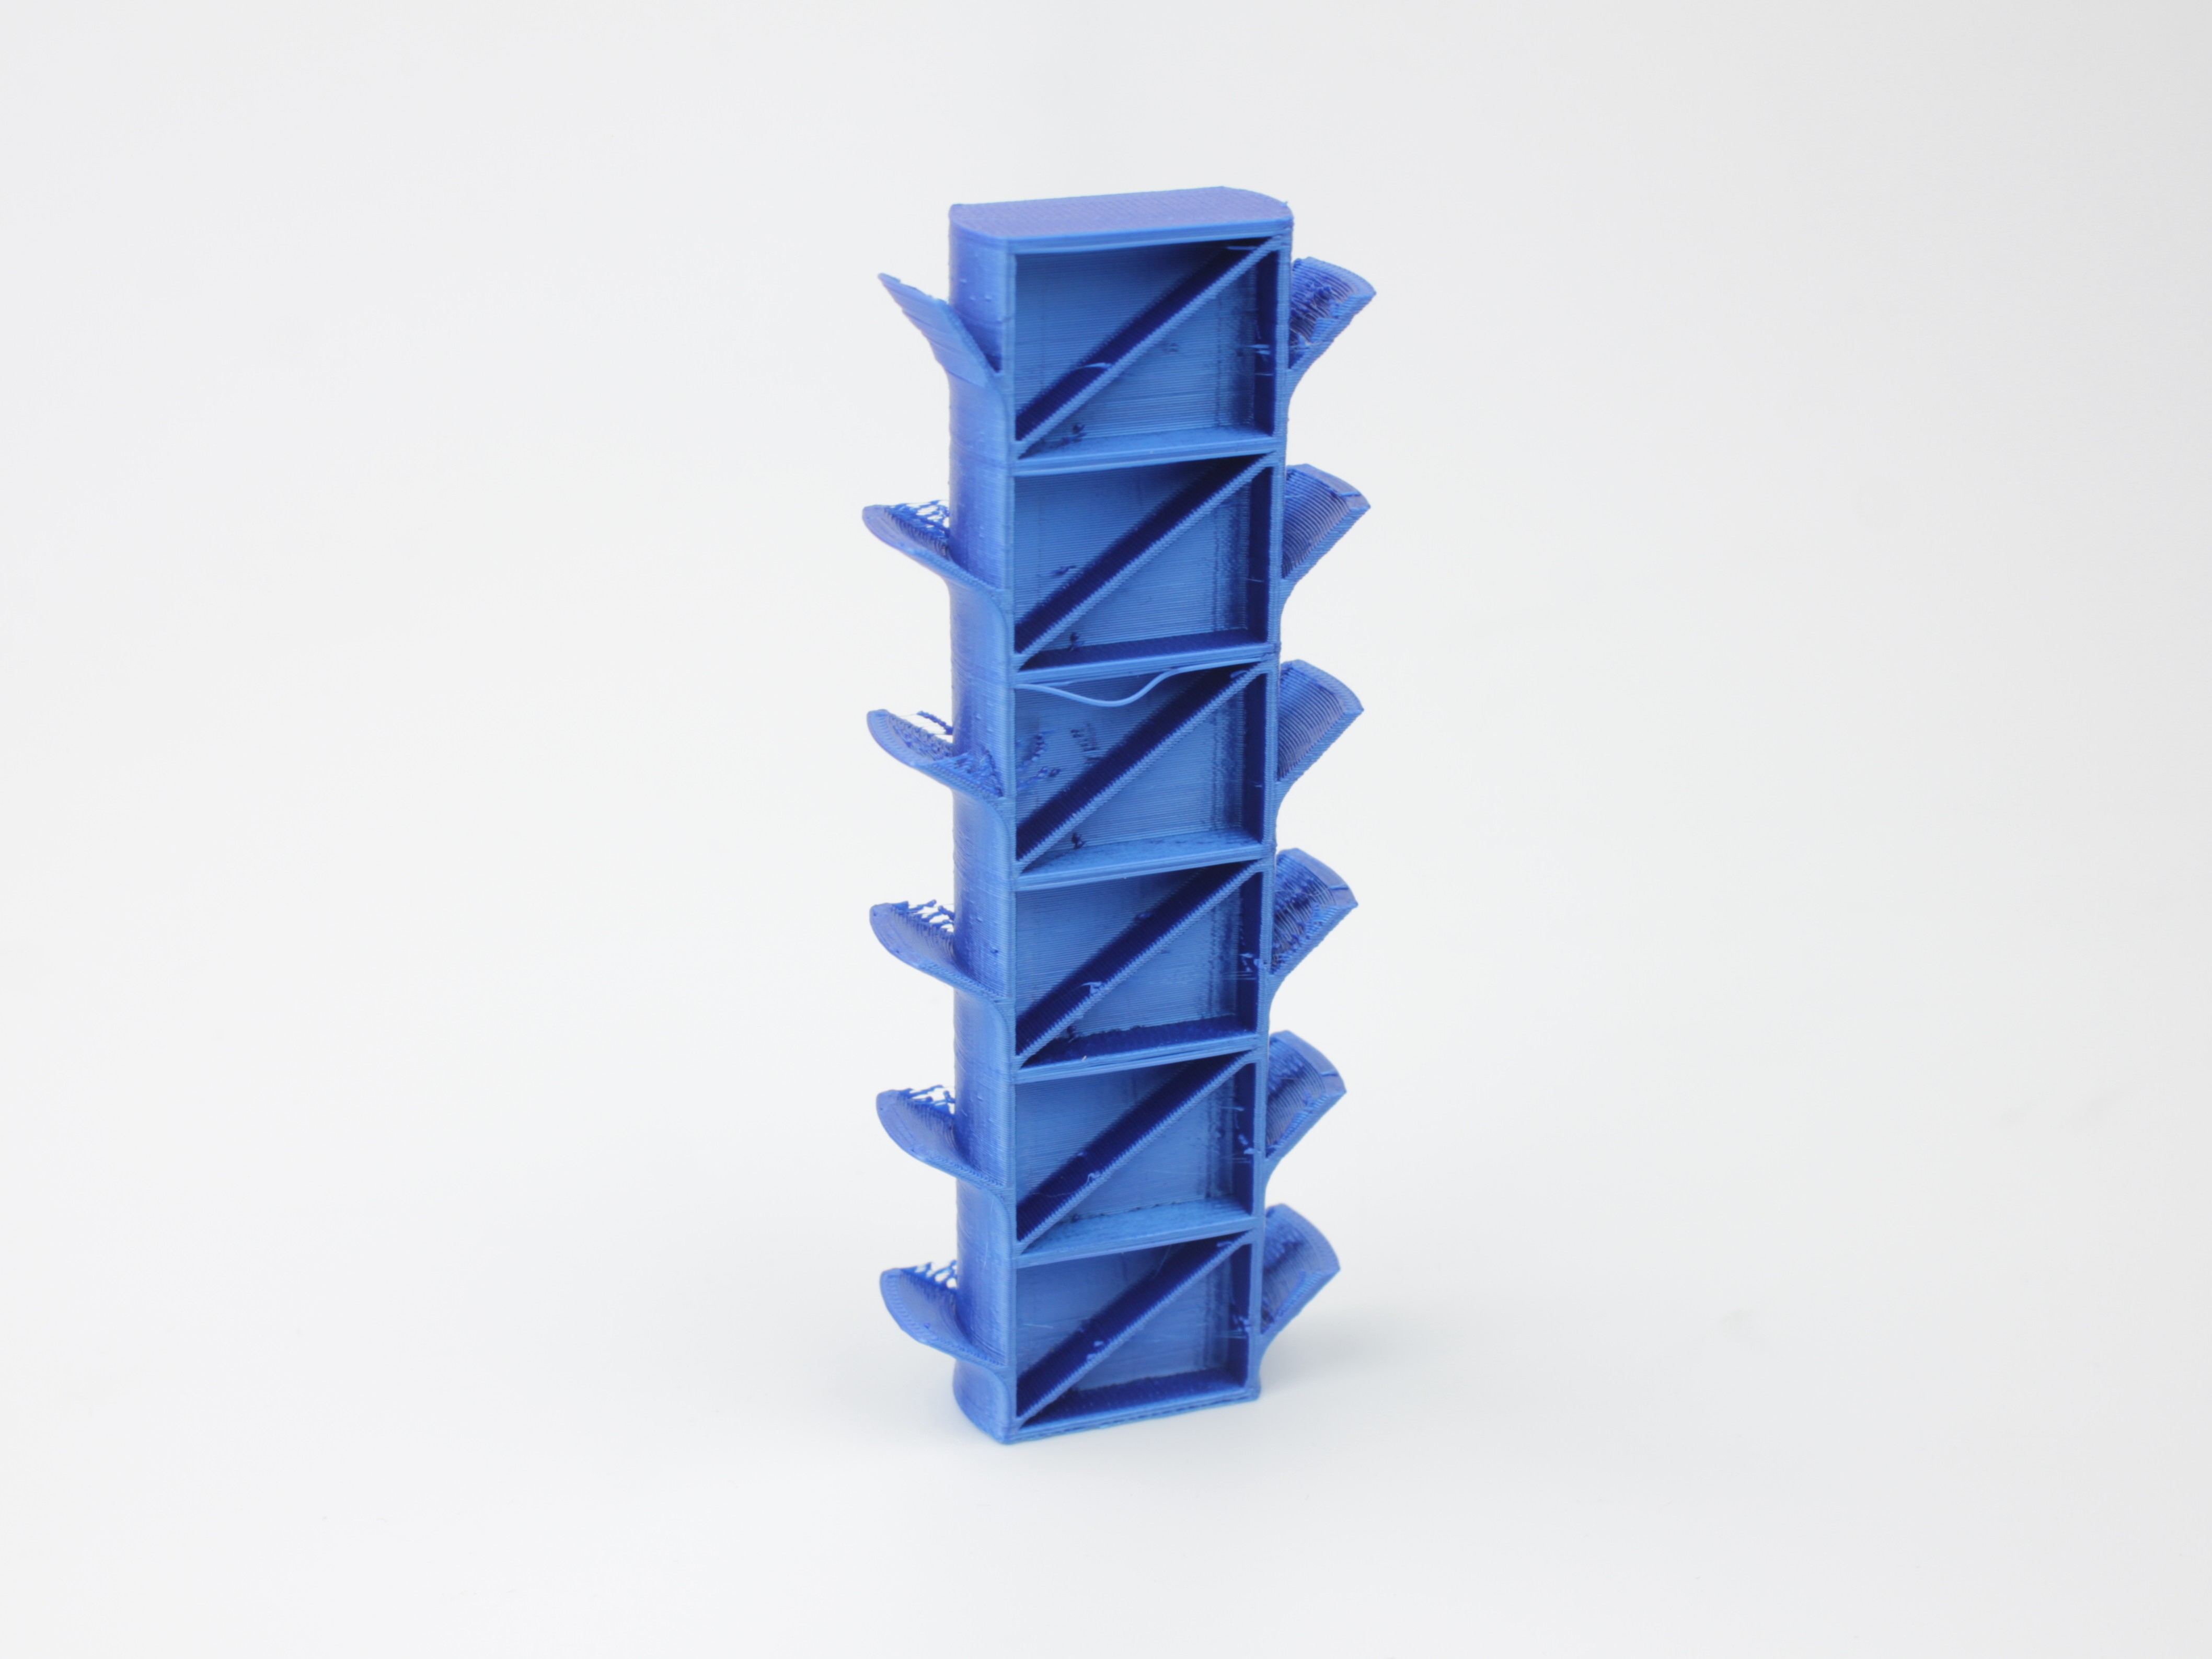
Completed temperature tower after removal from build plate. Inspect all six sections to compare print quality across temperature range.
Visual inspection - compare sections from bottom to top:
Too-cold signs (bottom sections):
- Poor layer adhesion - sections snap easily by hand
- Rough, under-melted surface texture
- Weak bridges and overhangs
- Visible layer separation
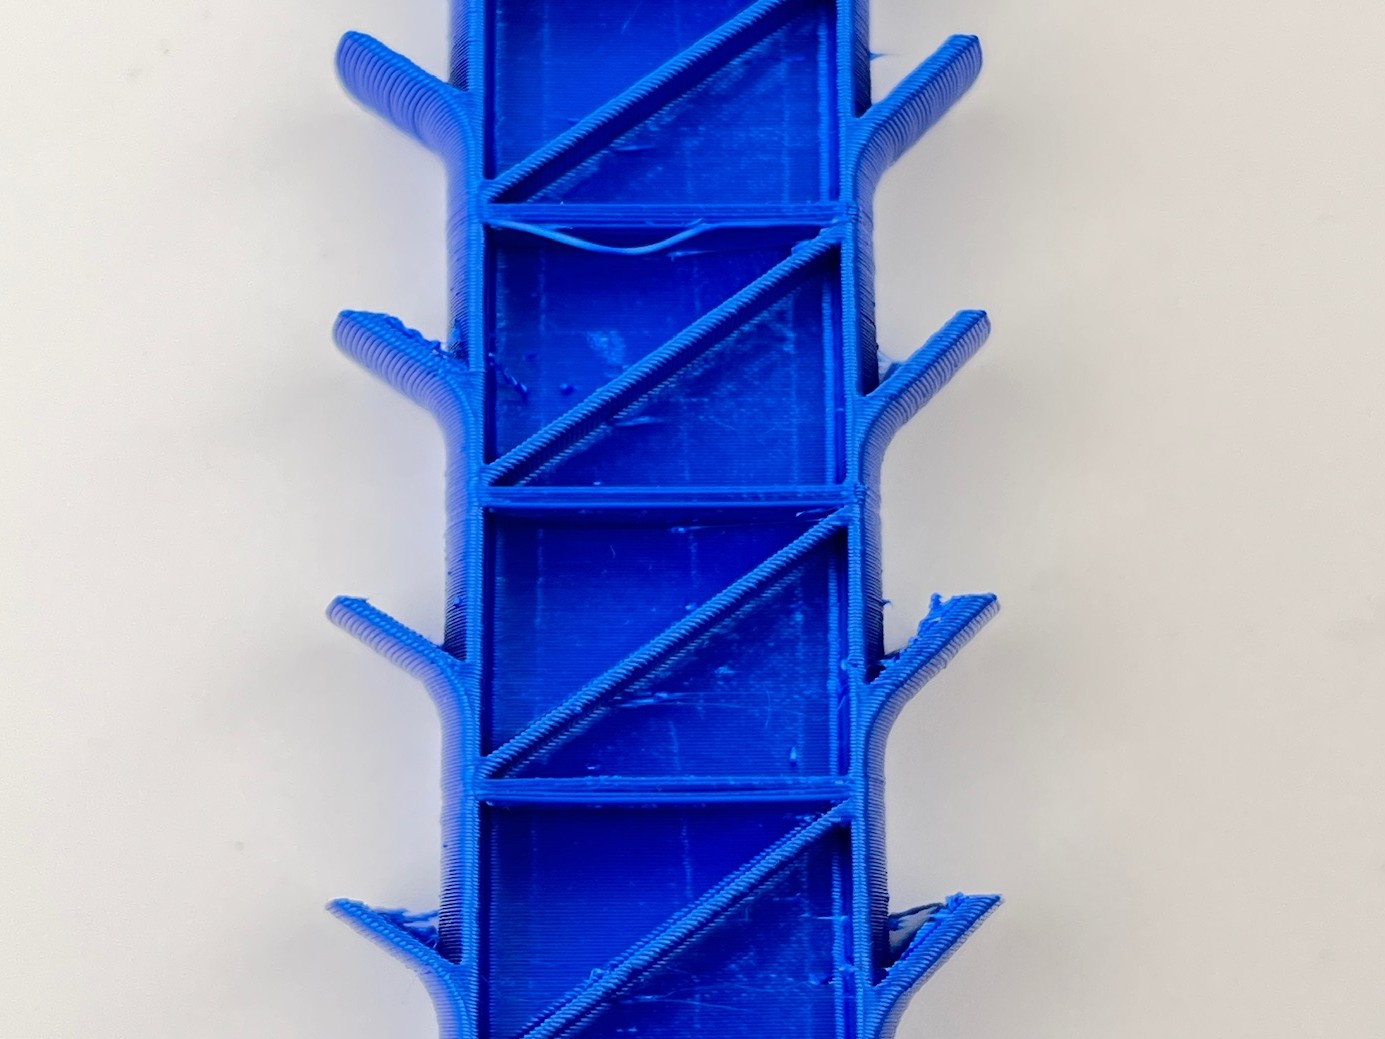
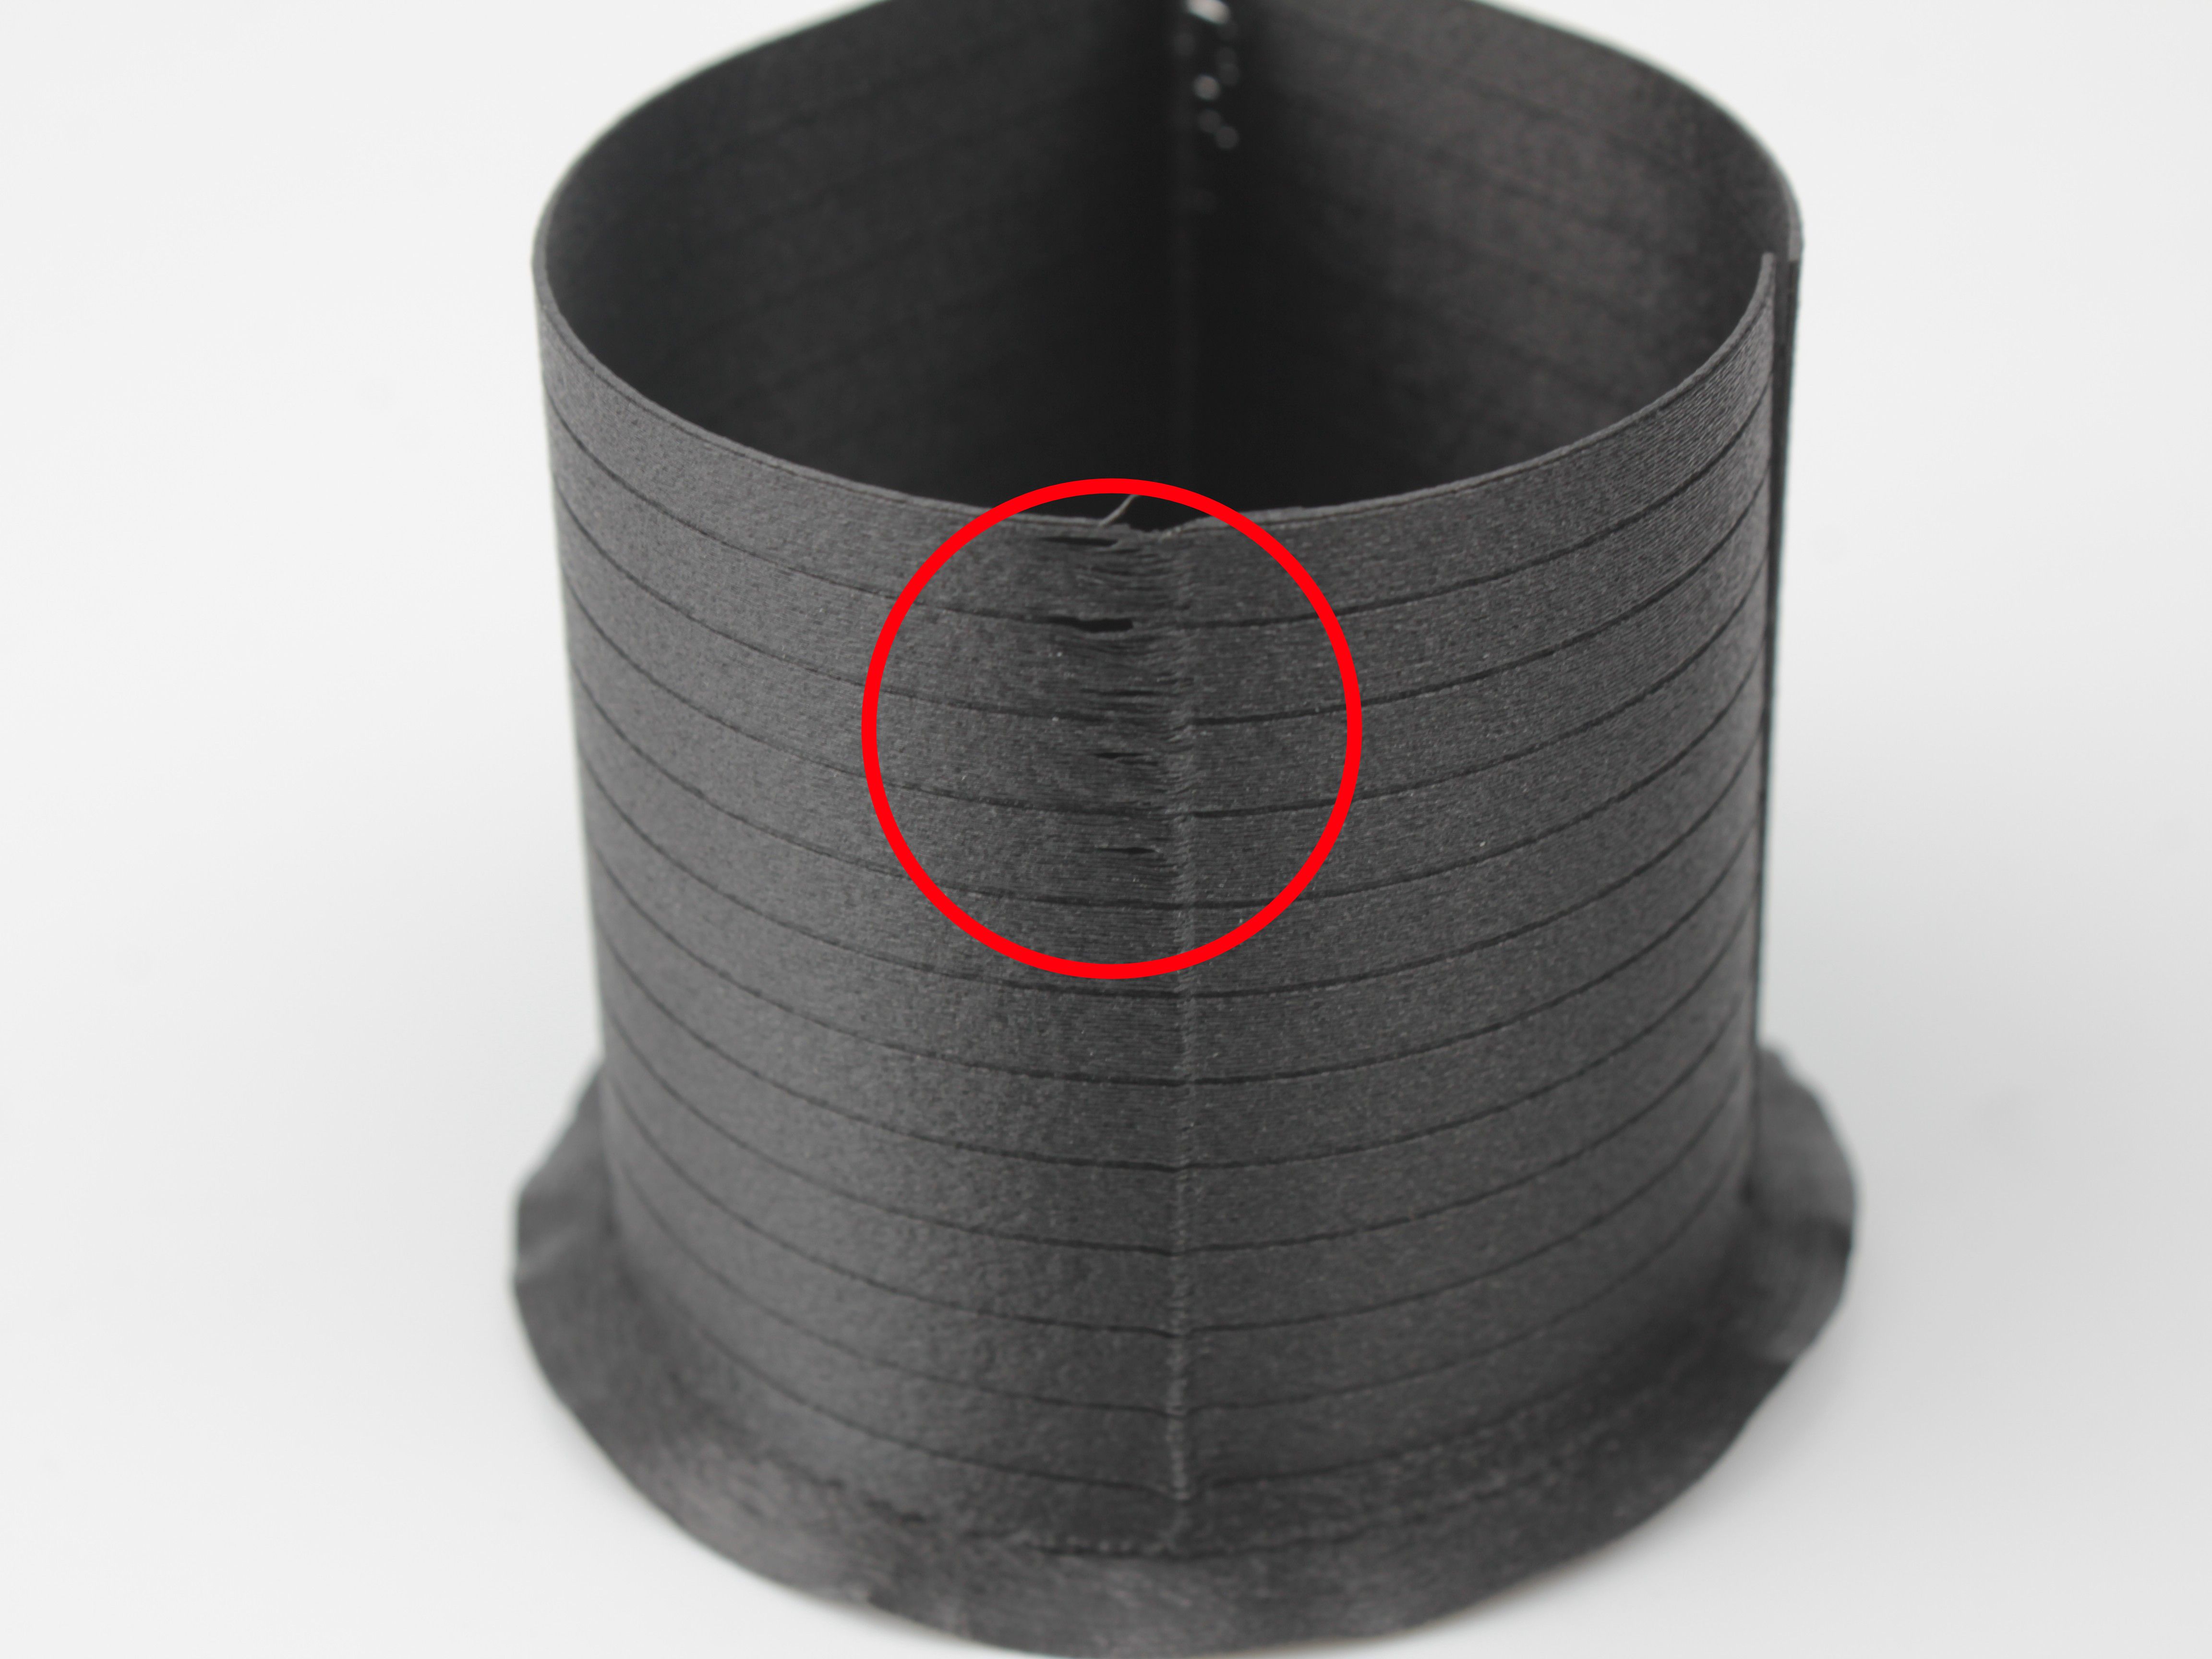
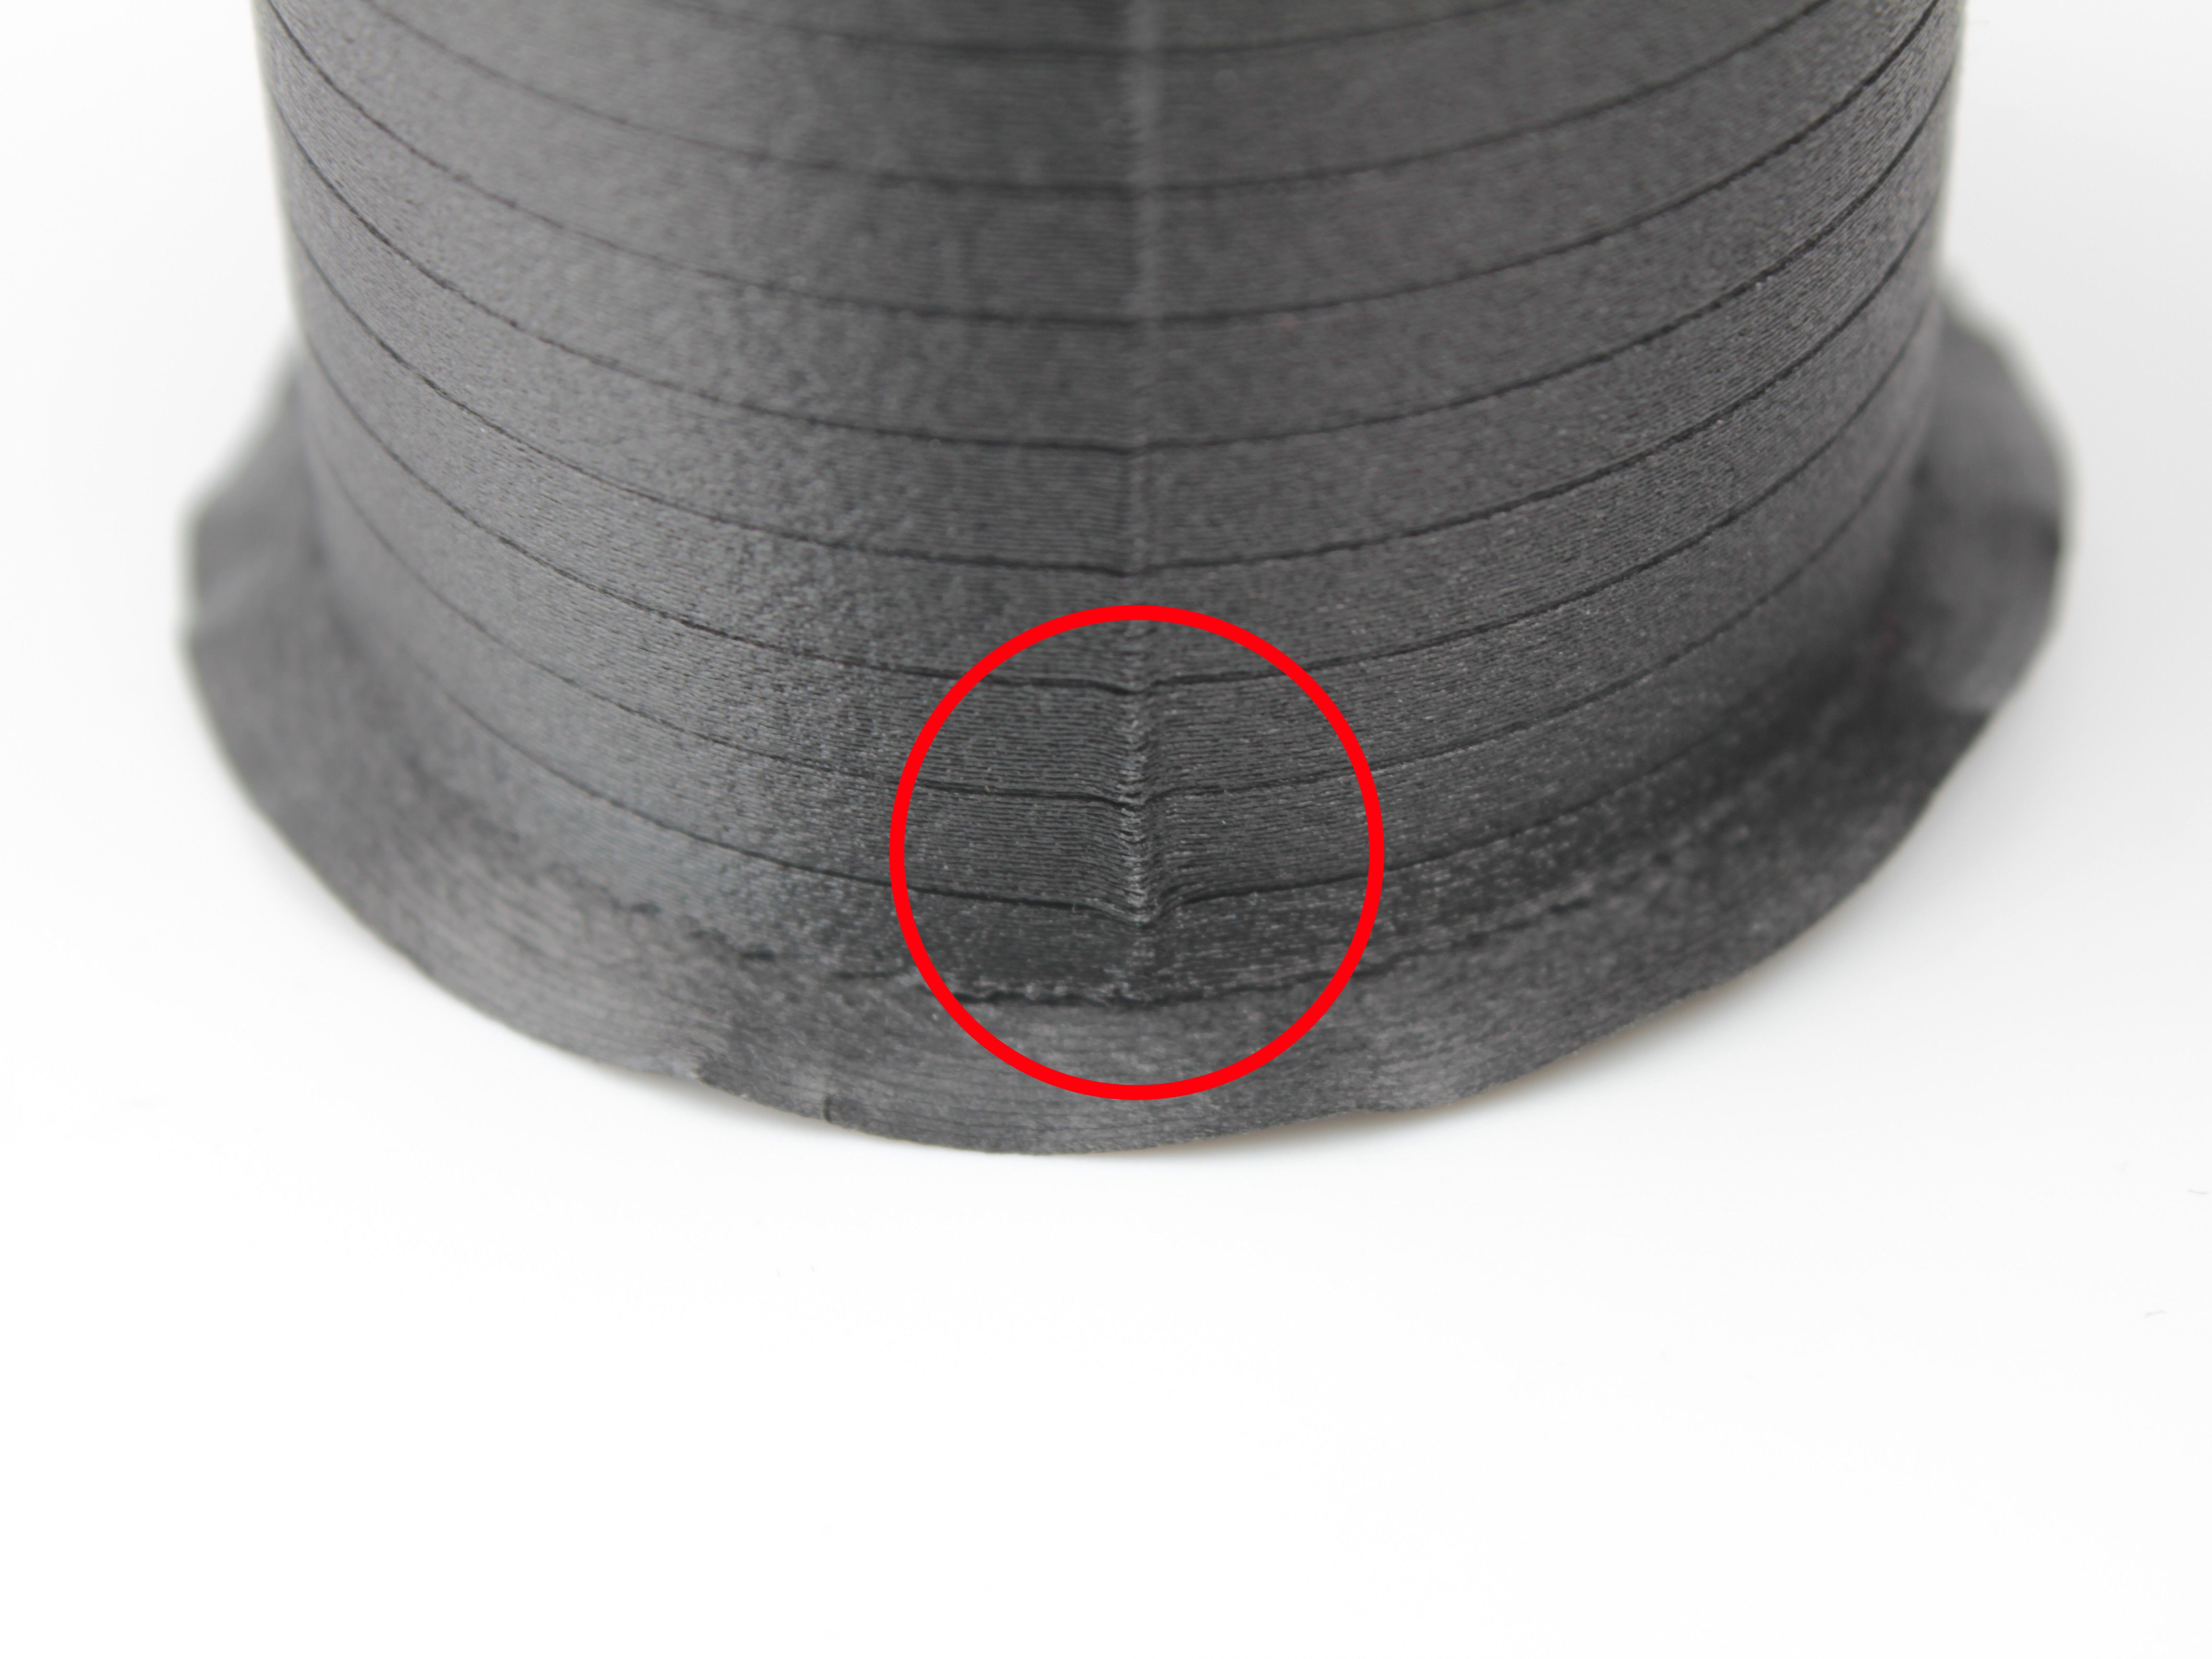
- Rolled or ribbed layer texture - filament not adhering properly to previous layer due to insufficient heat. Material cools too quickly before bonding, creating rolled, wavy appearance in layer structure.
Too low: Bottom section (lowest temperature) shows poor layer adhesion, rough texture, weak bonding. Filament creates rolled, wavy layer structure because it cools before bonding to previous layer.
Optimal temperature (middle sections):
- Clean, sharp edges and corners
- Smooth surface finish
- Good overhang and bridging quality
- Consistent layer lines
- Strong layer adhesion - difficult or impossible to snap by hand
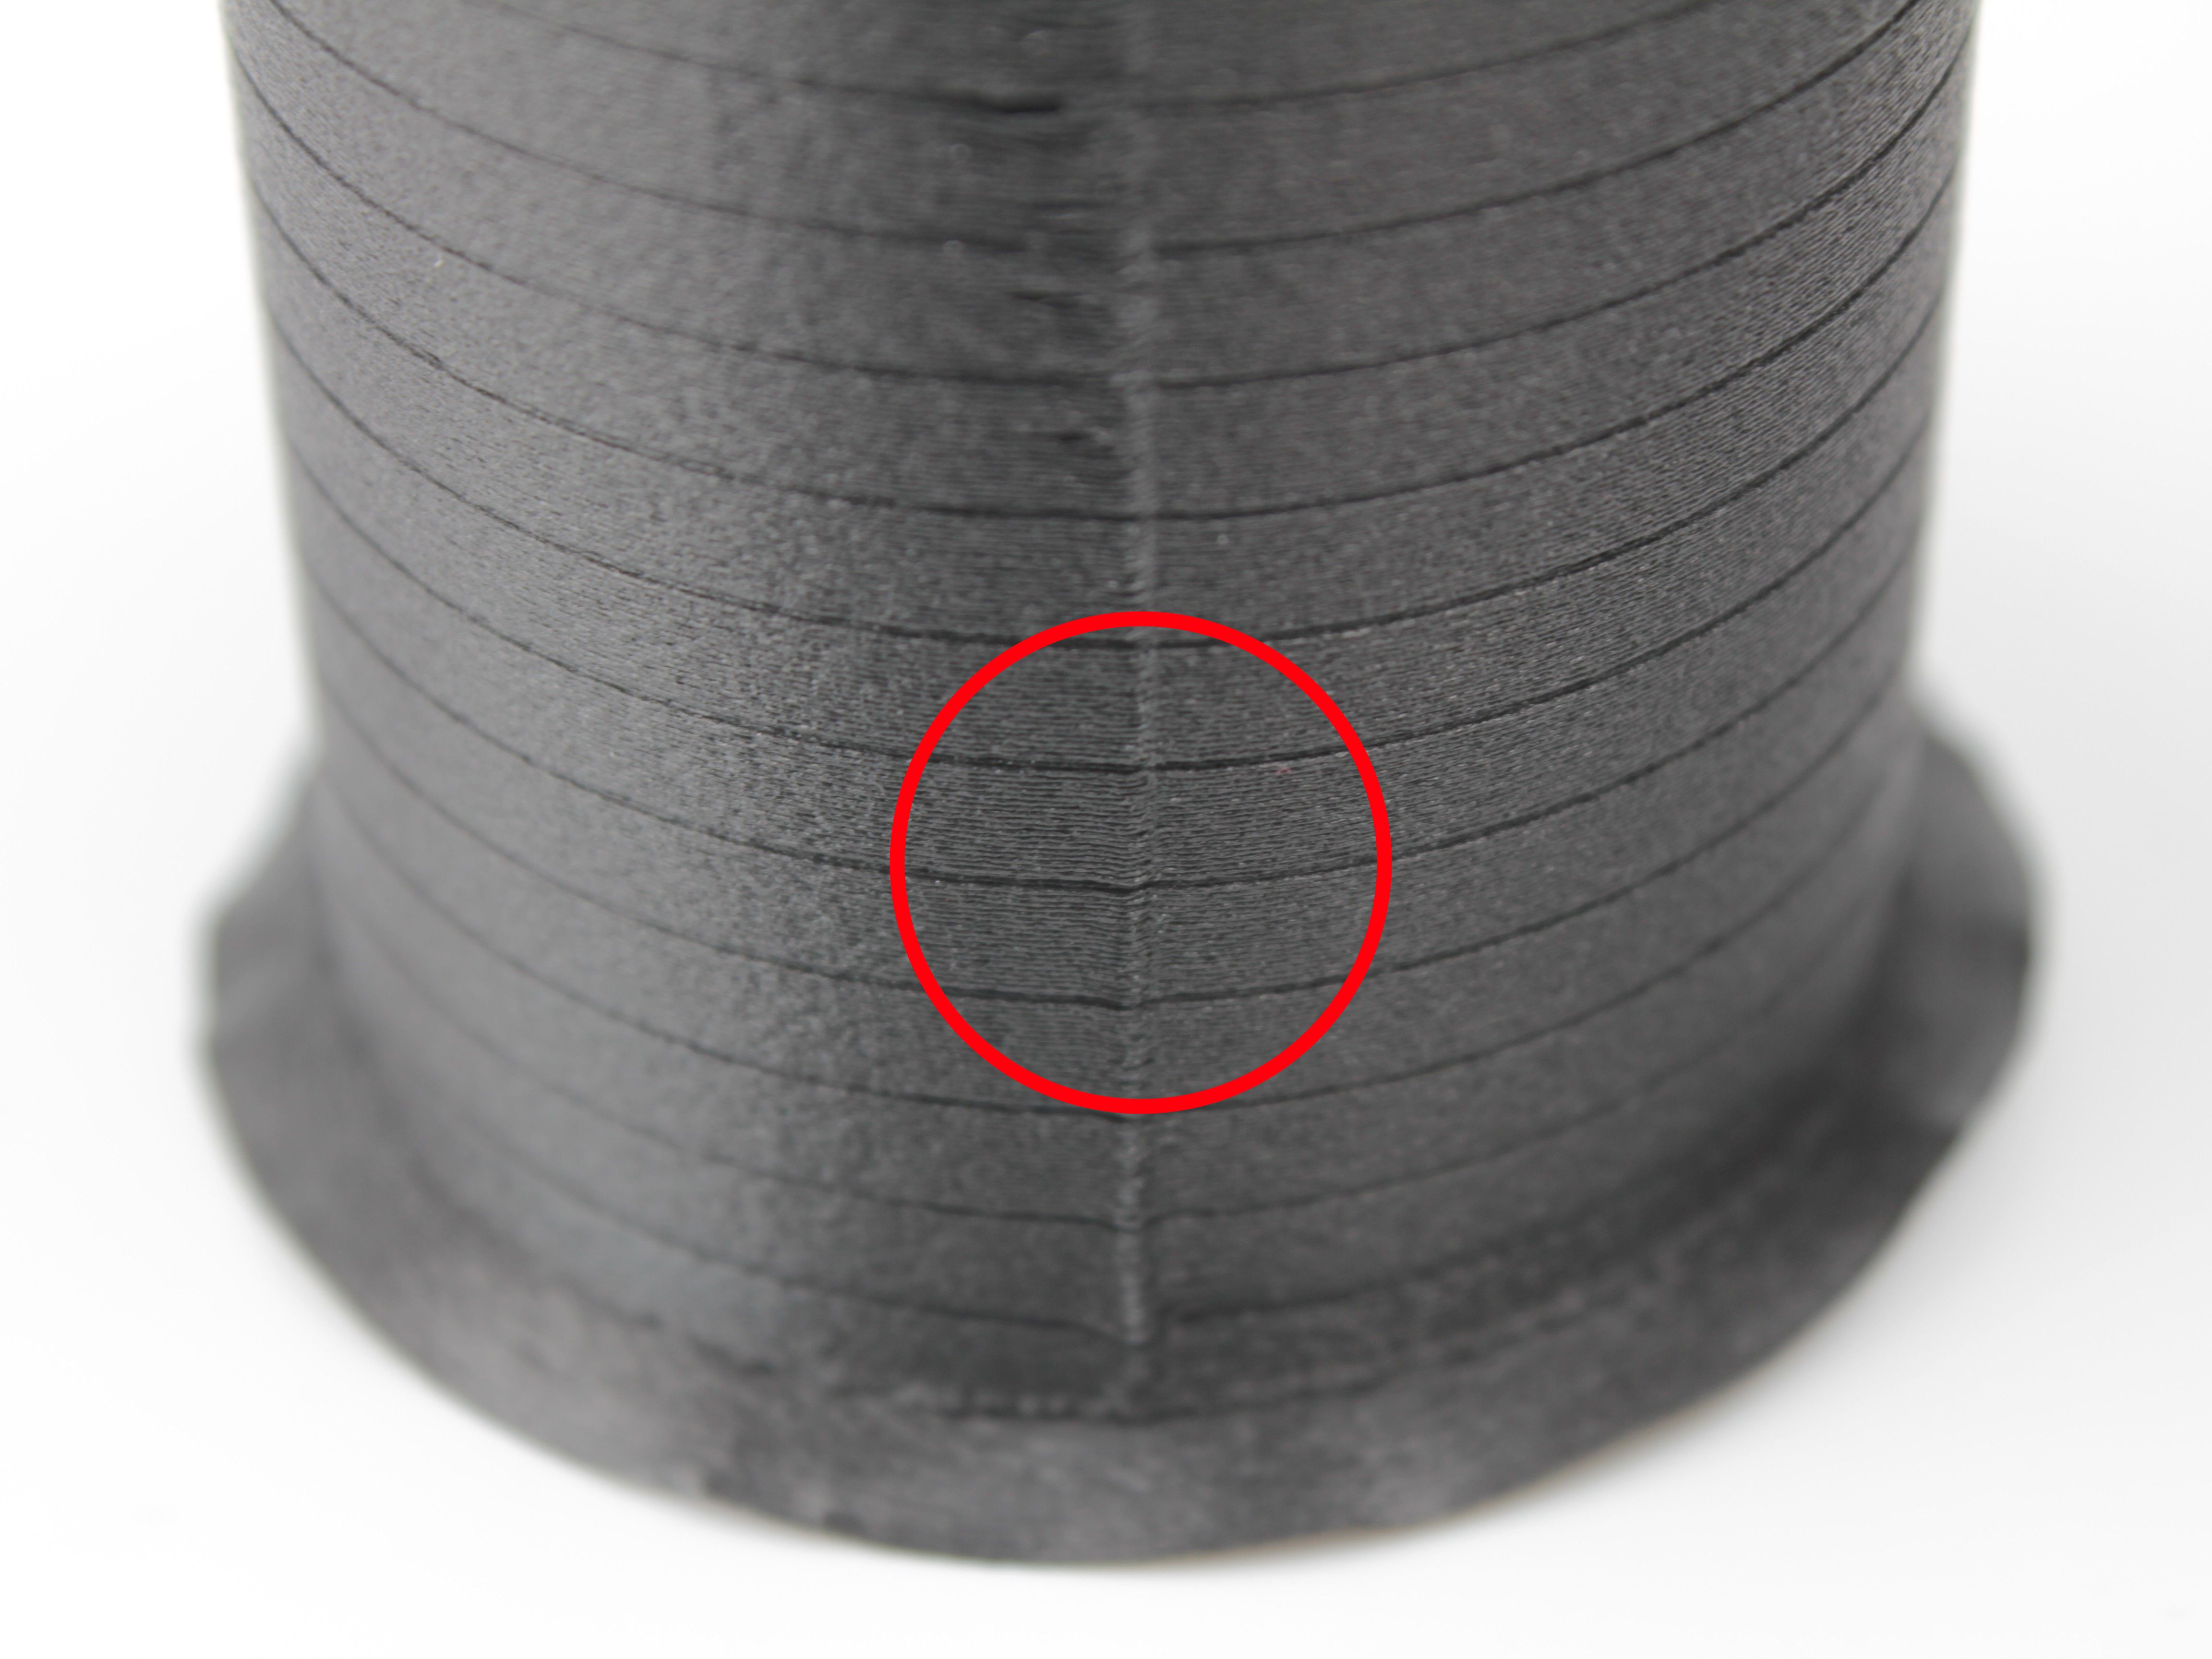
Optimal: Choose section between too-cold and too-hot zones with cleanest print quality, sharp details, and strongest layer adhesion.
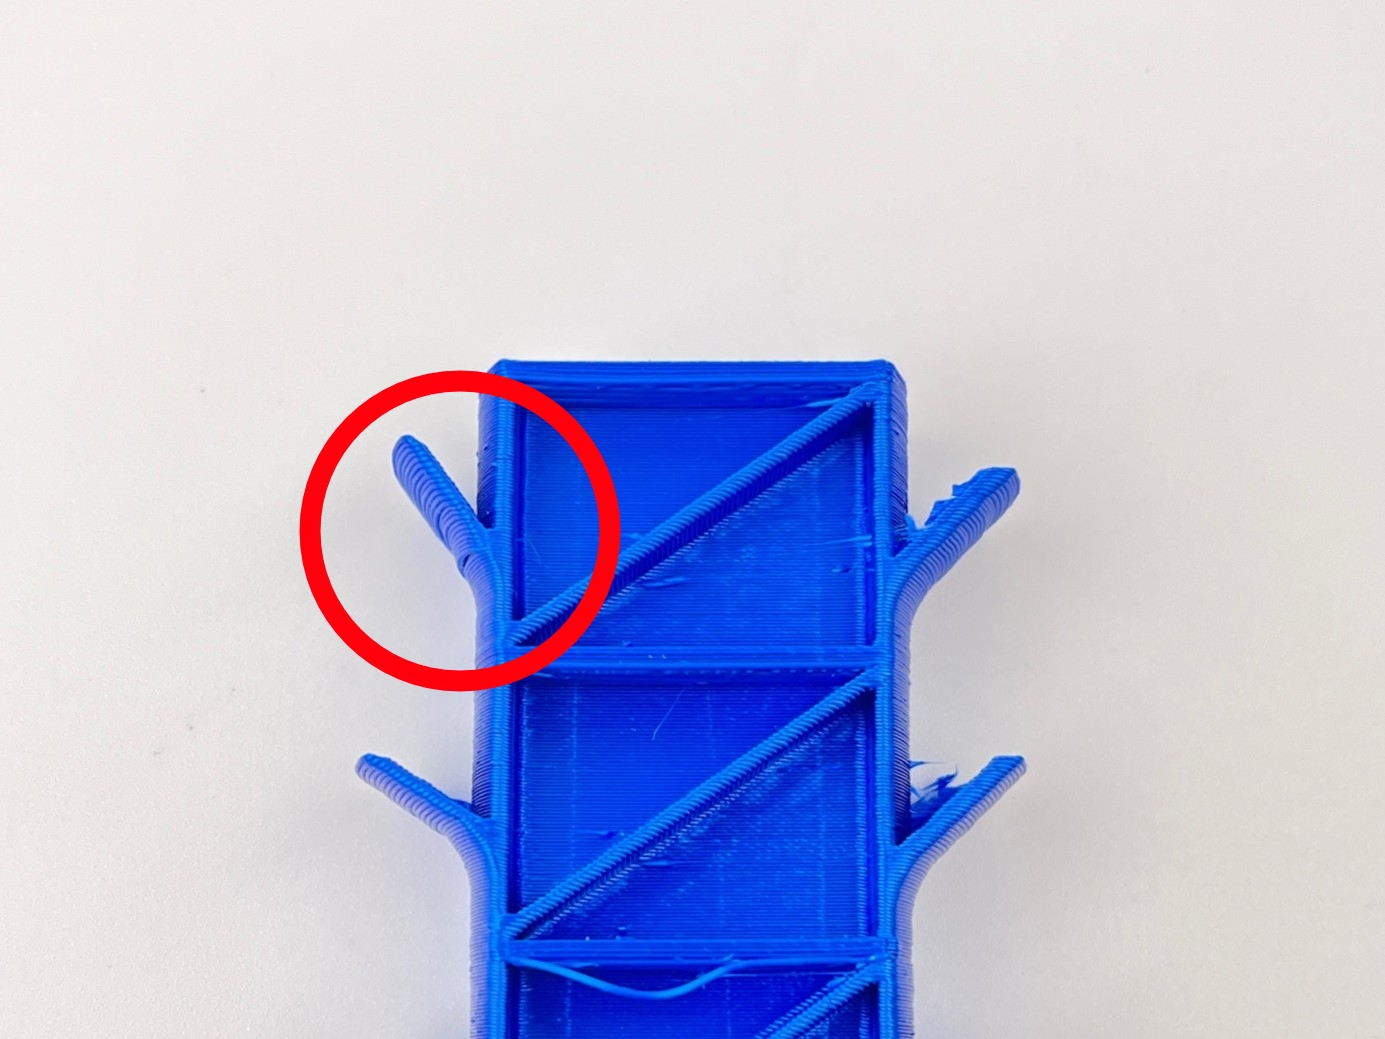
Too-hot signs (top sections):
- Glossy, melted appearance
- Excessive stringing - many fine threads trailing behind nozzle movements. Material overheats and becomes too fluid, oozing out uncontrollably.
- Drooping 45° overhangs - overhangs and bridges sag downward. Plastic overheats, loses structural rigidity, and flows before cooling.
- Loss of fine detail
- Material degradation (discoloration or brittleness)
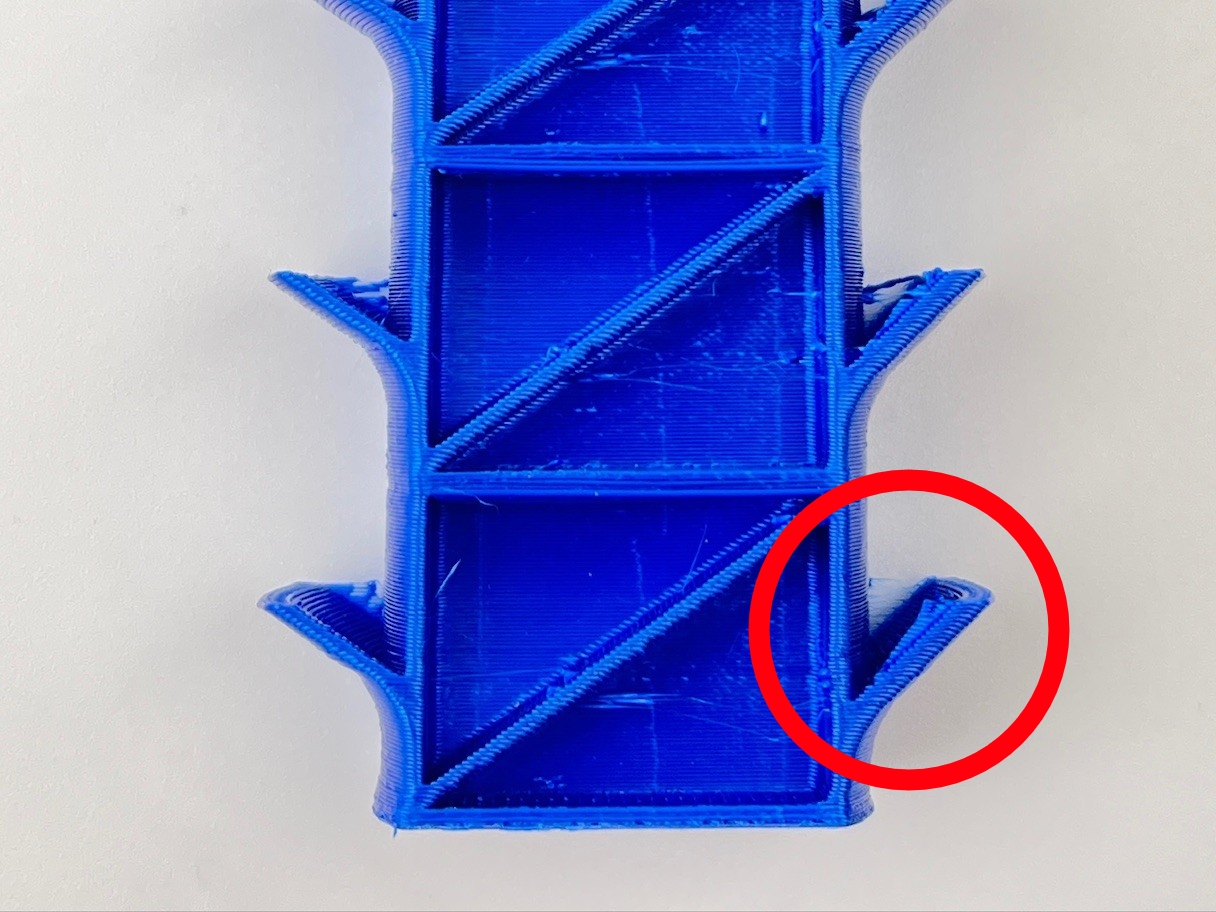
Too hot: Top section (highest temperature) shows excessive stringing threads, drooping 45° overhangs, glossy melted appearance. Plastic overheats, becomes too fluid, and flows uncontrollably.
- Break test: Starting at bottom section (lowest temperature), try snapping each section off along layer lines by hand. At low temperatures, sections snap easily with clean break - poor layer adhesion. As you move up, sections become progressively harder to break. Section requiring most force (or cannot be broken by hand) has strongest layer adhesion.
- Optimal temperature is section with strongest layer adhesion (hardest to break) that still maintains clean surface quality without signs of overheating or degradation.
Choosing between adjacent sections
If choosing between two adjacent sections with similar quality: pick higher temperature for functional parts (strength priority), pick lower for aesthetic parts (surface quality priority).
Record Results
- In Web Interface, navigate to
System > Resultsand open temperature tower results file. Match section number to exact temperature value. - Record optimal nozzle temperature (e.g., 390 °C). Use this value for remaining two tests.
2. Pressure Advance
Pressure Advance compensates for pressure build-up inside the hotend. Without compensation, molten plastic continues oozing after nozzle stops at corner or seam, creating blobs. Too much compensation causes gaps. The test prints a teardrop shape where pressure advance value increases from bottom to top, making blob-to-gap transition visible at single glance.
Run the Test
- Download latest Pressure Advance test file: pressure_advance_tuning.gcode. A copy ships under
Files > Jobs > Test Prints. - In Web Interface, go to
Files > Jobs, click Upload, add file. Select it and click Print. - When prompted, enter pressure advance range:
- If you have slicer profile with existing value, enter ±0.03 around it (e.g., 0.03-0.09 if profile shows 0.06).
- If starting from scratch, enter 0.00 to 0.15.
- Wait for print to finish - approximately 10-20 minutes. Printer produces teardrop shape with pressure advance increasing from bottom to top.
Analyze the Teardrop
Inspect two areas on teardrop:
- Rounded seam (back of teardrop). At bottom (low PA), you see visible bulge where material oozed out. Moving upward, bulge shrinks and eventually disappears. Higher still, gap or indent appears where firmware retracts too much material.
- Sharp corner (front of teardrop). At optimal PA, corner is sharp and well-defined. When PA too high, corner becomes rounded and loses sharpness.
Optimal: Clean seam with no bulge, no gap, and sharp front corner.
Too low: Visible bulge at seam where material oozed out after nozzle stopped.
Too high: Gap or indent at seam where firmware retracted too much material.
- Find height where back seam is clean (no bulge, no gap) and front corner is still sharp. Mark this height on print with marker.
Inspection lighting
Inspect under bright, directional lighting. Blobs catch light and appear shinier; gaps show as shadows or indentations.
Measure and Record
- Use calipers to measure distance in millimeters from bottom of print to marked optimal point.
- In Web Interface, navigate to
System > Resultsand open pressure advance results file. Find row matching measured height - pressure advance value in that row is optimal setting. If measurement falls between two rows, pick closer value or interpolate. - Record optimal pressure advance value (e.g., 0.055).
Filament moisture sensitivity
Pressure advance is sensitive to filament moisture. If blobs or gaps return after period of use, dry filament thoroughly and verify value still holds.
3. Flow Rate Calibration
Flow rate test fine-tunes amount of material extruded per move. Under-extrusion leaves gaps between lines (weak parts). Over-extrusion creates rough, wavy surface and dimensional inaccuracy. Test prints series of flat squares, each at different flow rate percentage, so you identify exact multiplier producing solid layers without excess material.
Each test square builds on 10 layers of infill, bridged with solid layer, then topped with 20 solid layers. This eliminates first-layer variables and accumulates flow rate effect over many layers.
Run the Test
- Download latest Flow Rate test file: flow_rate_tuning.gcode. A copy ships under
Files > Jobs > Test Prints. - Clean build plate and apply glue stick or adhesive.
- In Web Interface, go to
Files > Jobs, click Upload, add file. Select it and click Print. Test starts automatically - no additional parameters required. - Wait for print to finish - approximately 30-45 minutes. Printer produces multiple labeled squares (typically 13) in grid. Each square labeled with flow adjustment:
-12,-10,-8…0…+8,+10,+12, where0= 100 % flow (baseline). Negative = under-extrusion, positive = over-extrusion.
Analyze the Squares
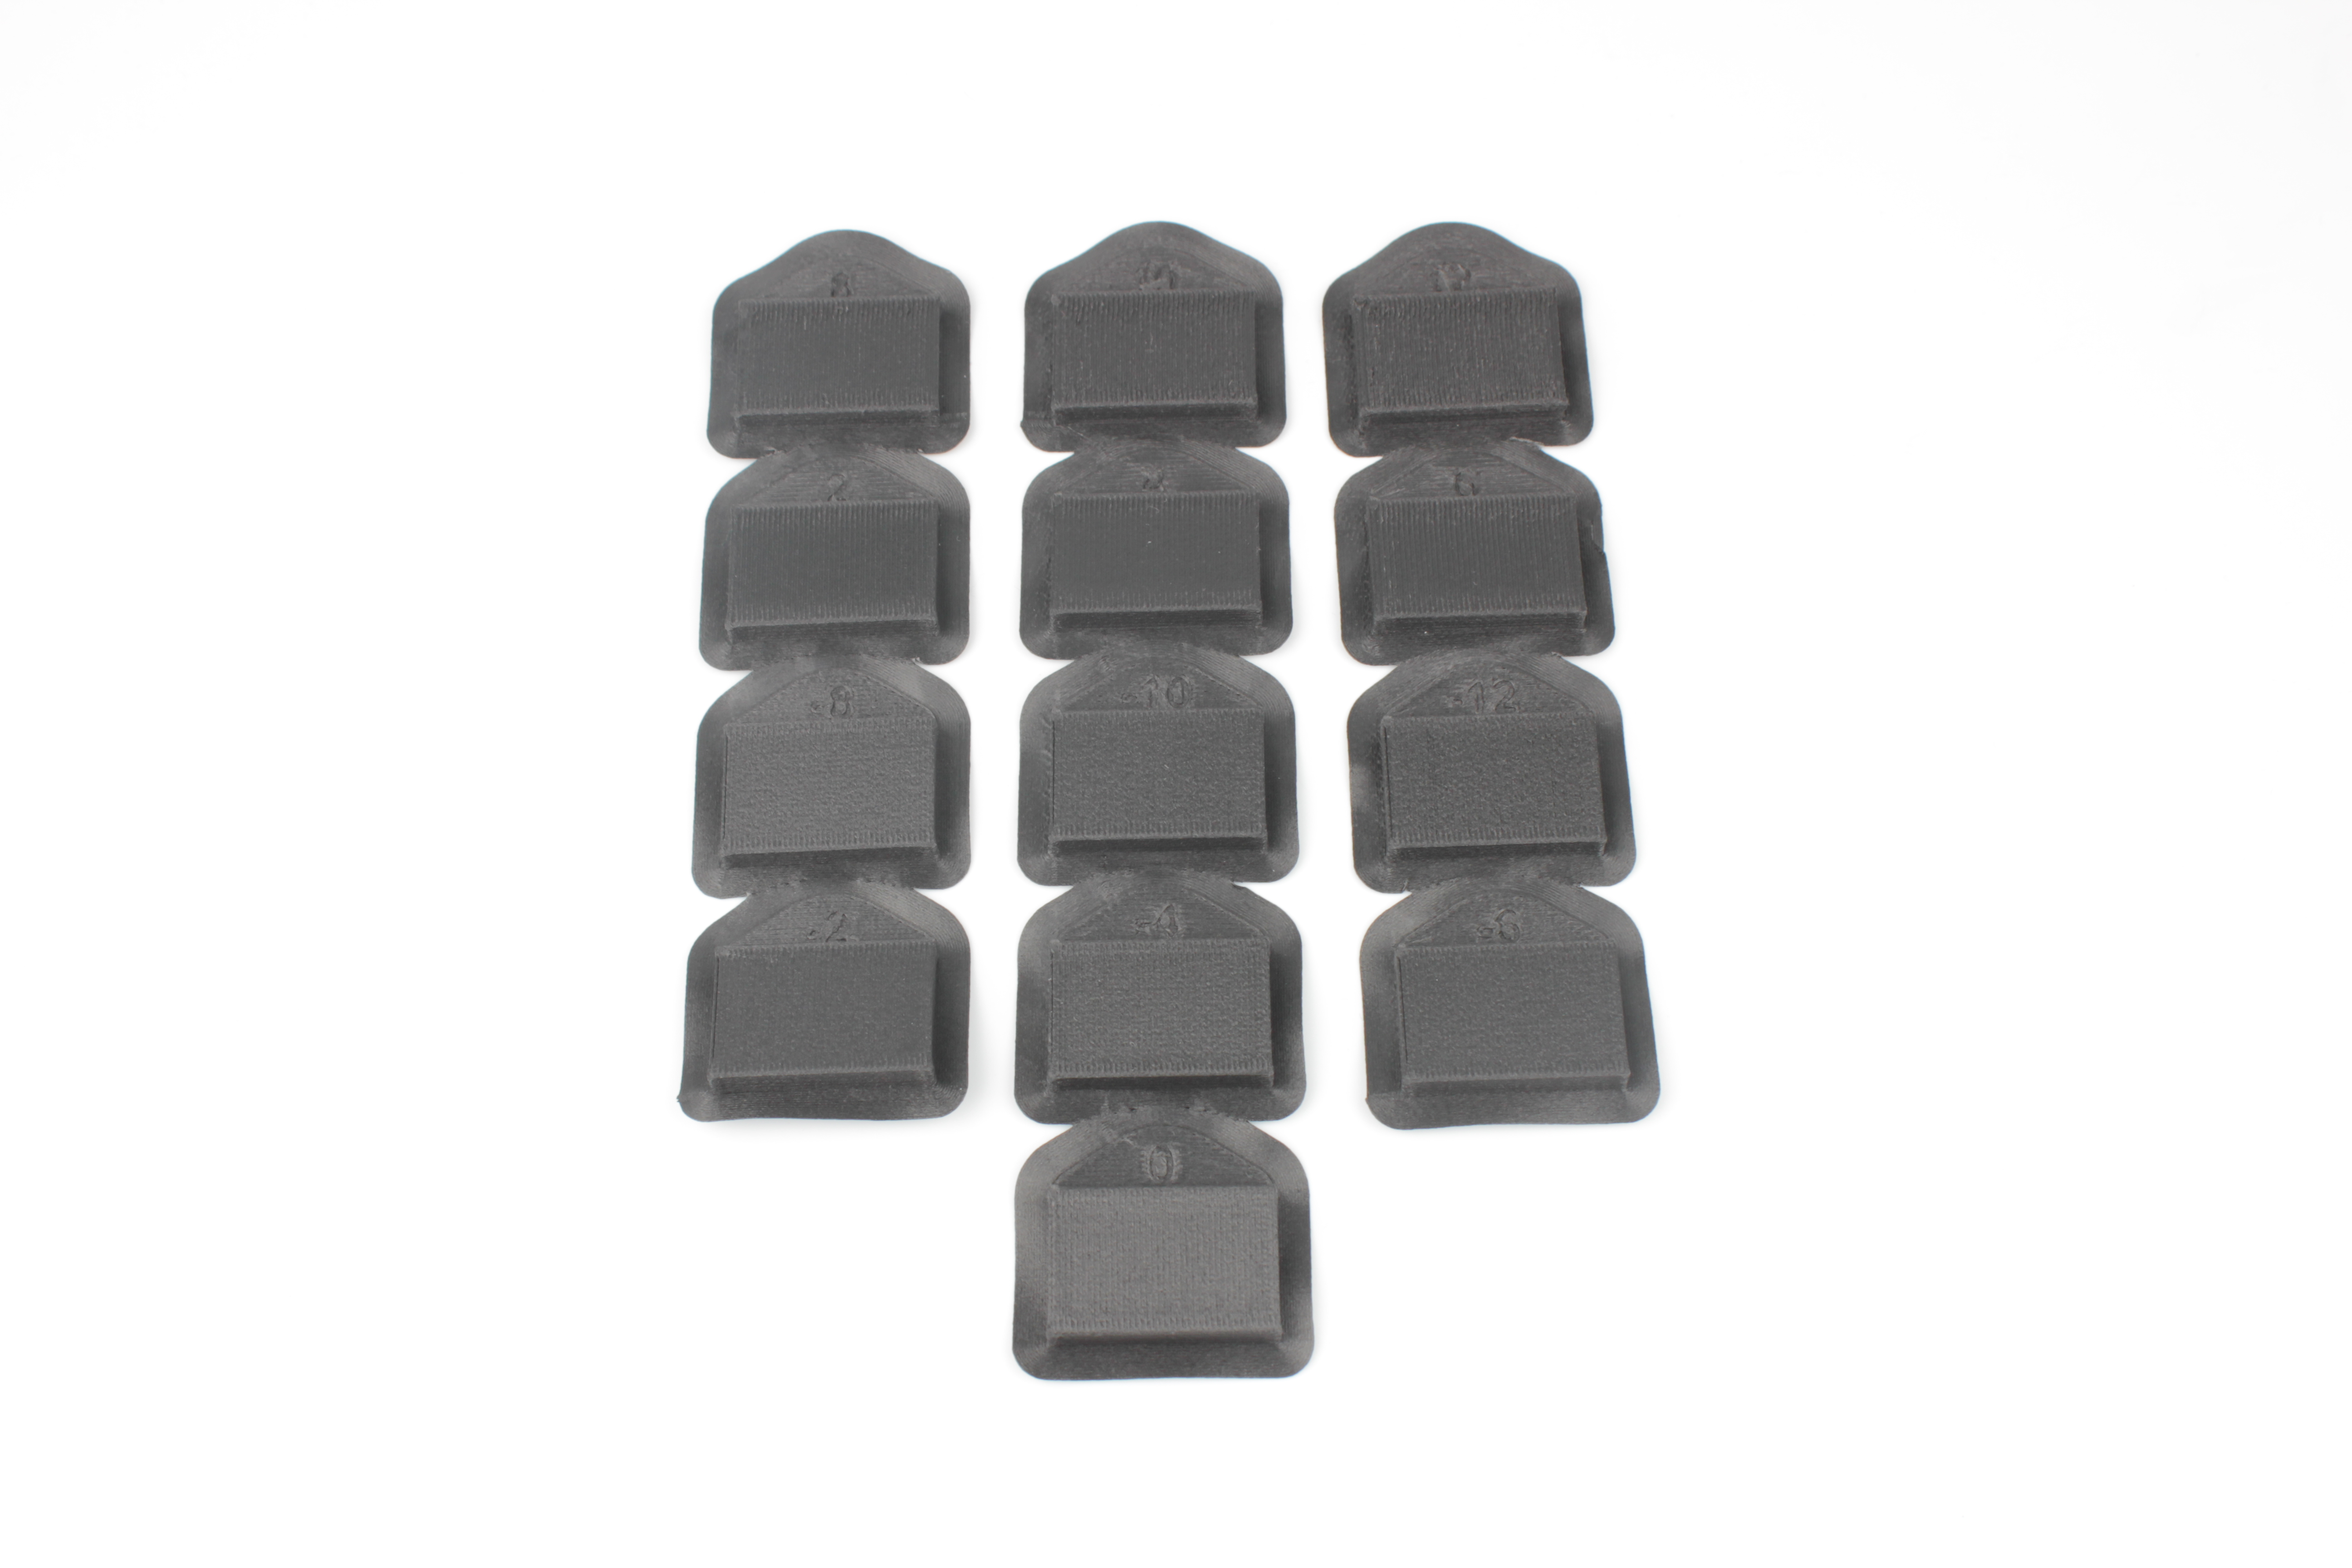
Completed flow rate test showing all 13 squares with labels from -12 (under-extrusion) to +12 (over-extrusion). Use visual and tactile inspection to identify optimal square.
Use both visual and tactile inspection:
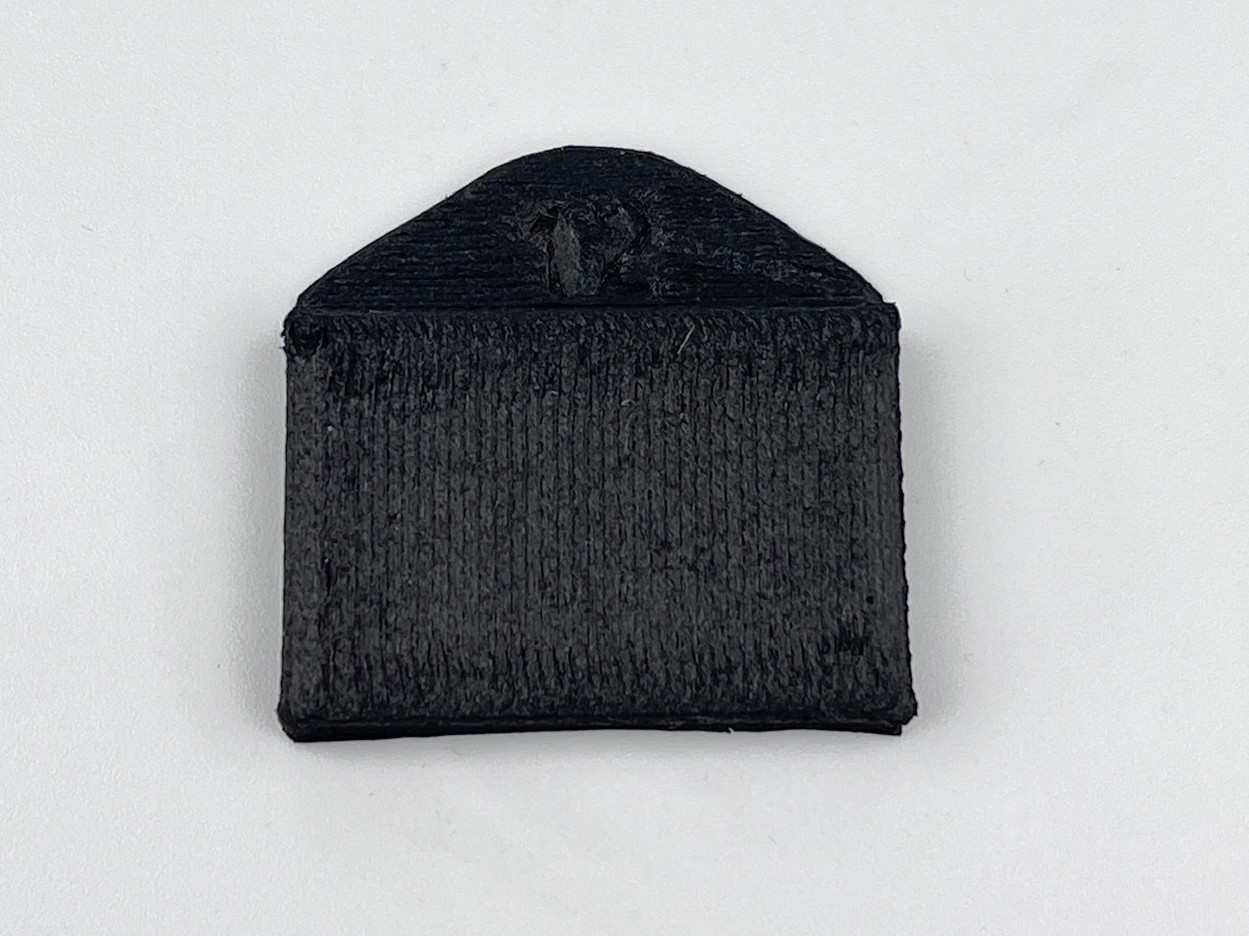
- Visual inspection. Start with most under-extruded square (e.g.,
-12). You see clear gaps between extrusion lines - layer below visible through gaps. Move toward higher values until gaps disappear. Continue past baseline - at some point, lines merge and surface becomes wavy and bumpy (over-extrusion).
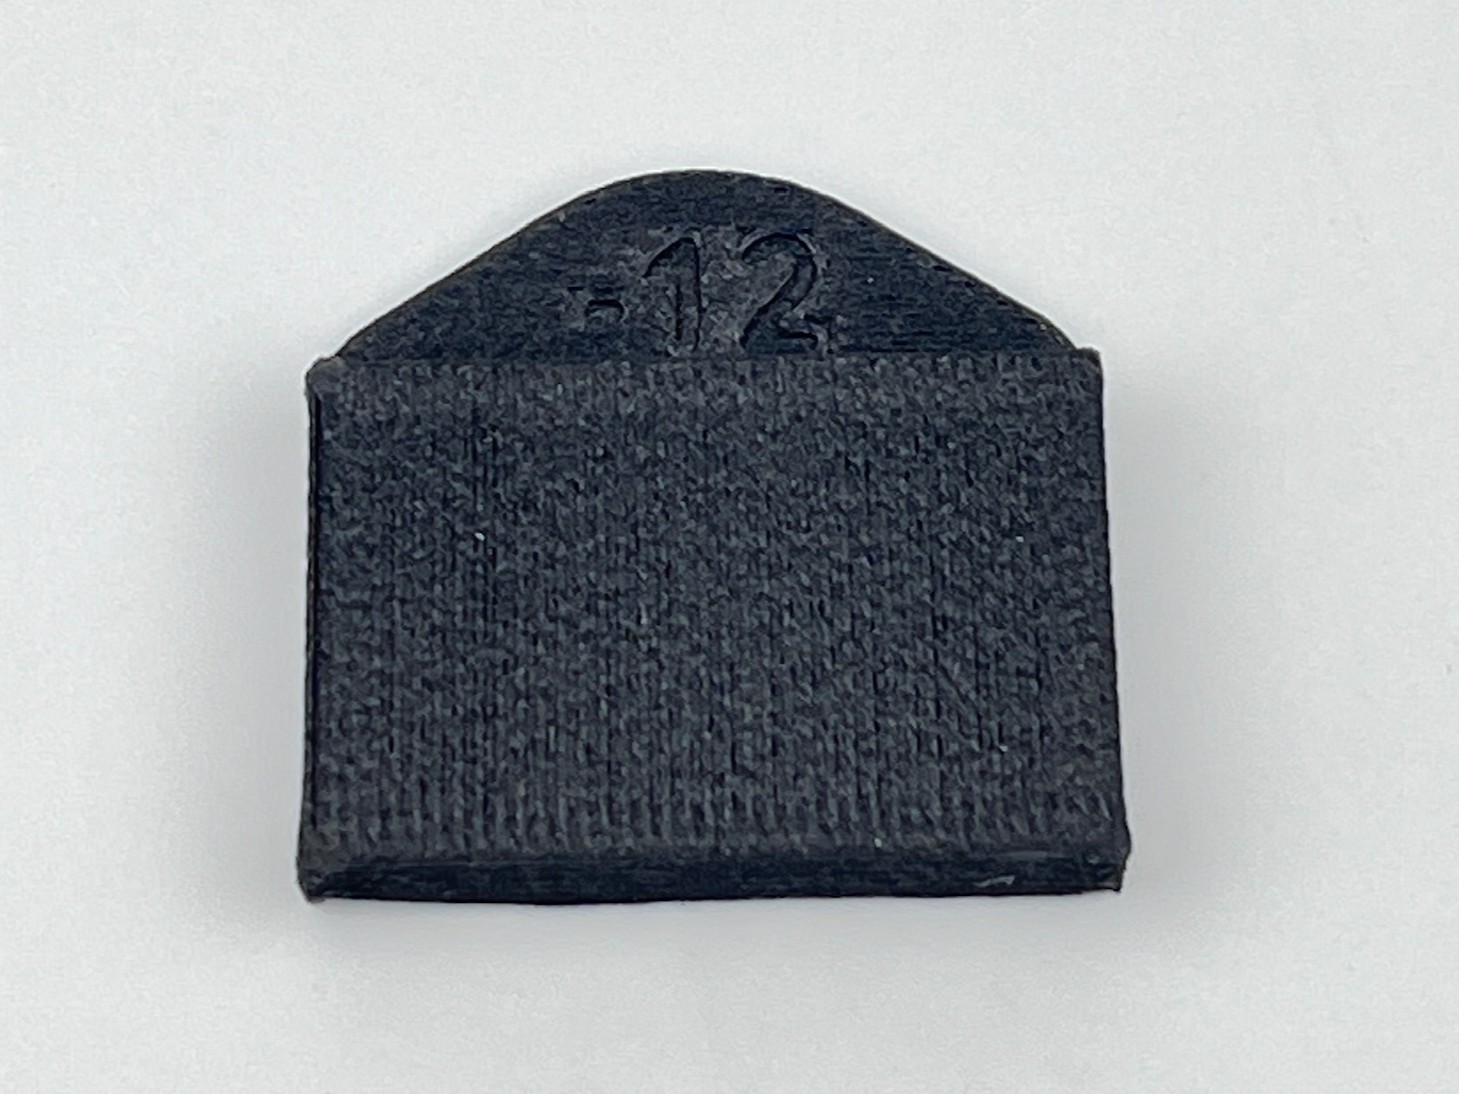
Under-extrusion (-12): Clear gaps between extrusion lines, layer below visible through gaps.
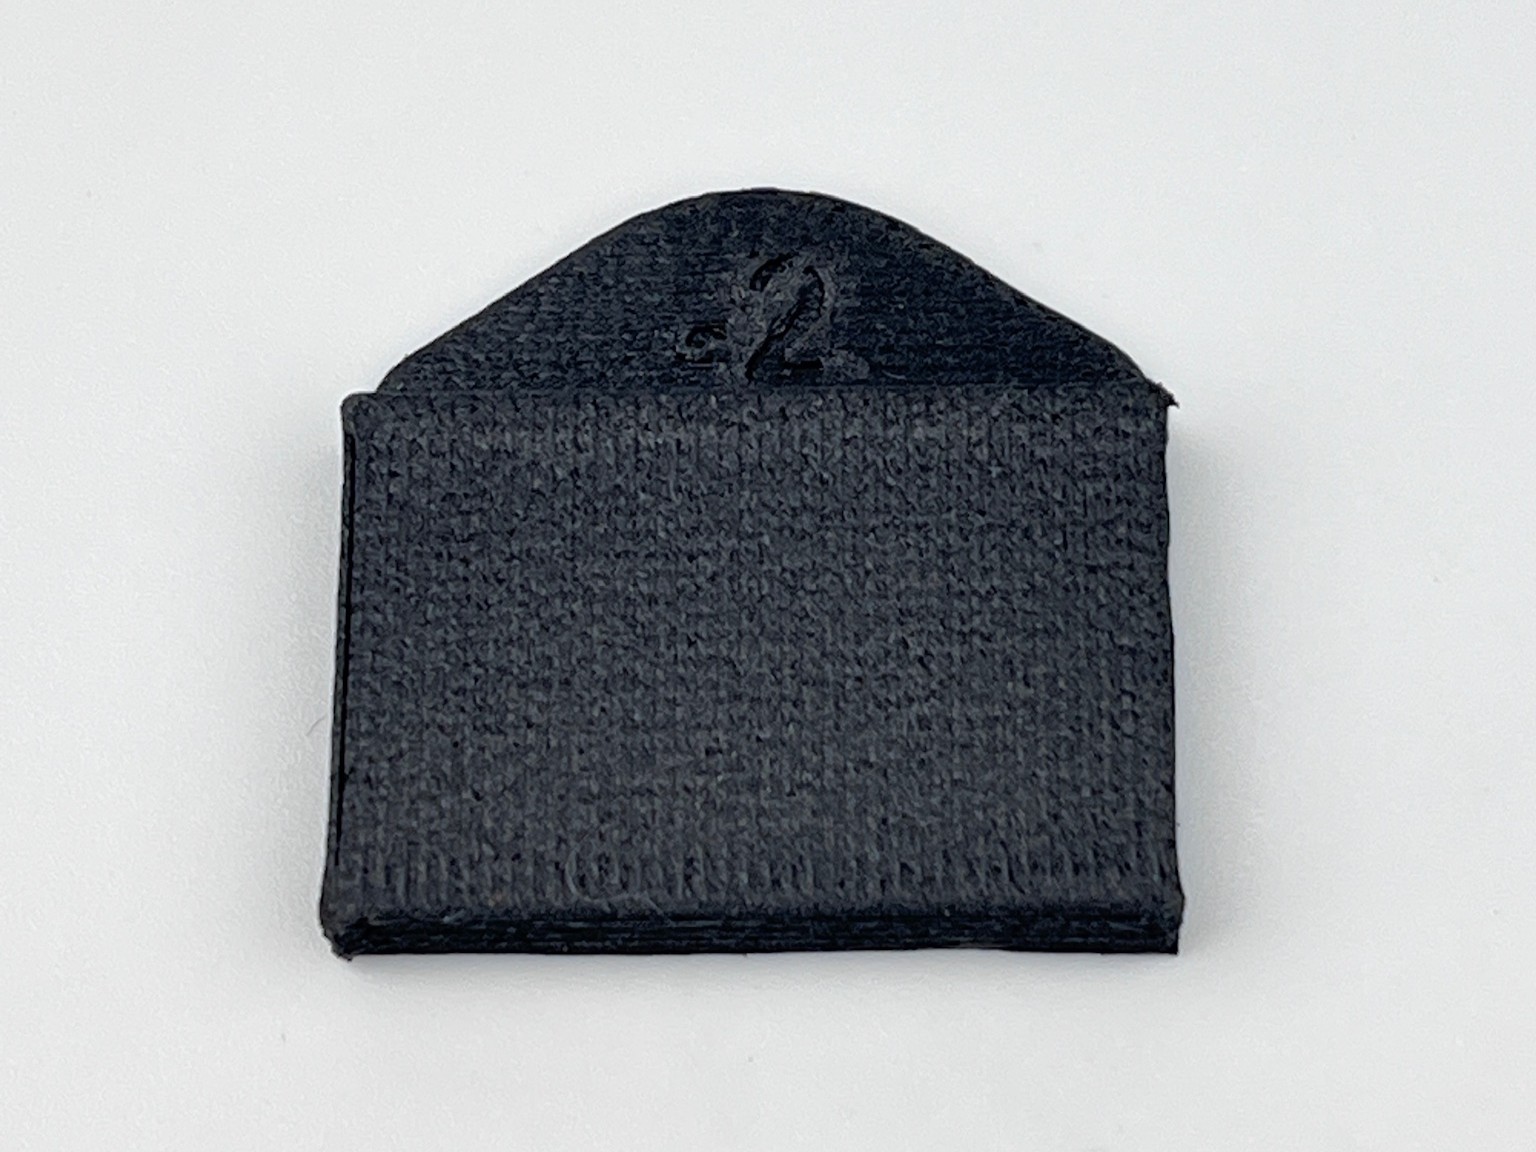
Optimal (-2): Solid layers with no gaps, smooth surface with slight line texture.
Over-extrusion (+12): Lines merge creating rough, wavy, bumpy surface.
- Tactile inspection. Run finger across top surface of each square, perpendicular to extrusion lines. Under-extruded squares feel smooth but fingernail catches in gaps. Optimal squares feel smooth with slight line texture. Over-extruded squares feel rough and bumpy with raised ridges.
- Optional: inspect under microscope (20-40× magnification) for precise identification of transition from visible gaps to no gaps.
Optimal flow rate is square where:
- No visible gaps between extrusion lines
- Surface not rough or wavy
- Surface feels smooth with slight line texture
Filled materials adjustment
For filled materials (carbon fiber, glass fiber), add +2 % to +4 % above visually optimal square. Fibers cause slightly inconsistent extrusion - extra flow ensures part is completely solid.
Record Results
- Identify labeled square representing optimal flow rate (e.g.,
+4). - Convert label to extrusion multiplier value for slicer:
| Label | Flow Percentage | Extrusion Multiplier |
|---|---|---|
-6 | 94 % | 0.94 |
-2 | 98 % | 0.98 |
0 | 100 % | 1.00 |
+4 | 104 % | 1.04 |
+8 | 108 % | 1.08 |
+12 | 112 % | 1.12 |
- Record extrusion multiplier (e.g., 1.04).
4. Save to Slicer
With all three values determined, save them into slicer filament profile so they apply automatically to every print with this material. Steps below use PrusaSlicer. For Cura or Simplify3D, see FAQ.
- Go to
Configuration > Preferences, set View mode to Expert, click OK. - Click Filament dropdown (top-right corner) and select profile closest to your material. Click Save icon (floppy disk) and enter descriptive name - e.g.,
PPS CF10 - Fiberon - Tuned 390C. - In
Filament Settings > Temperature, set both First layer and Other layers nozzle temperature to optimal value from Temperature Calibration (e.g., 390 °C). - In
Filament Settings > Extrusion(near top), set Extrusion multiplier to value from Flow Rate Calibration (e.g., 1.04). - In
Filament Settings > Custom G-code > Start G-code, add following line with pressure advance value from Pressure Advance:
M572 D0:1 S0.055Replace 0.055 with calibrated value. M572 sets pressure advance; D0:1 applies it to both extruder drives (Drive 0 and Drive 1) on Vision Miner 22IDEX V4.
- Click Save icon to save profile. Select this profile in filament dropdown before slicing any print with this material.
FAQ
Troubleshooting
Support
If you could not find an answer here, reach out to our support team.